When a generic drug company wants to get approval for a new product, they don’t need to run another full clinical trial. Instead, they run a bioequivalence (BE) study-a focused trial that proves their version of the drug behaves the same way in the body as the original. But here’s the catch: if the statistics are wrong, the whole study fails. And it’s not just about running tests. It’s about knowing exactly how many people to enroll. Too few, and you might miss a real difference. Too many, and you waste money, time, and expose more people to unnecessary procedures. This isn’t guesswork. It’s math-rigorous, regulated math.
Why Power and Sample Size Matter in BE Studies
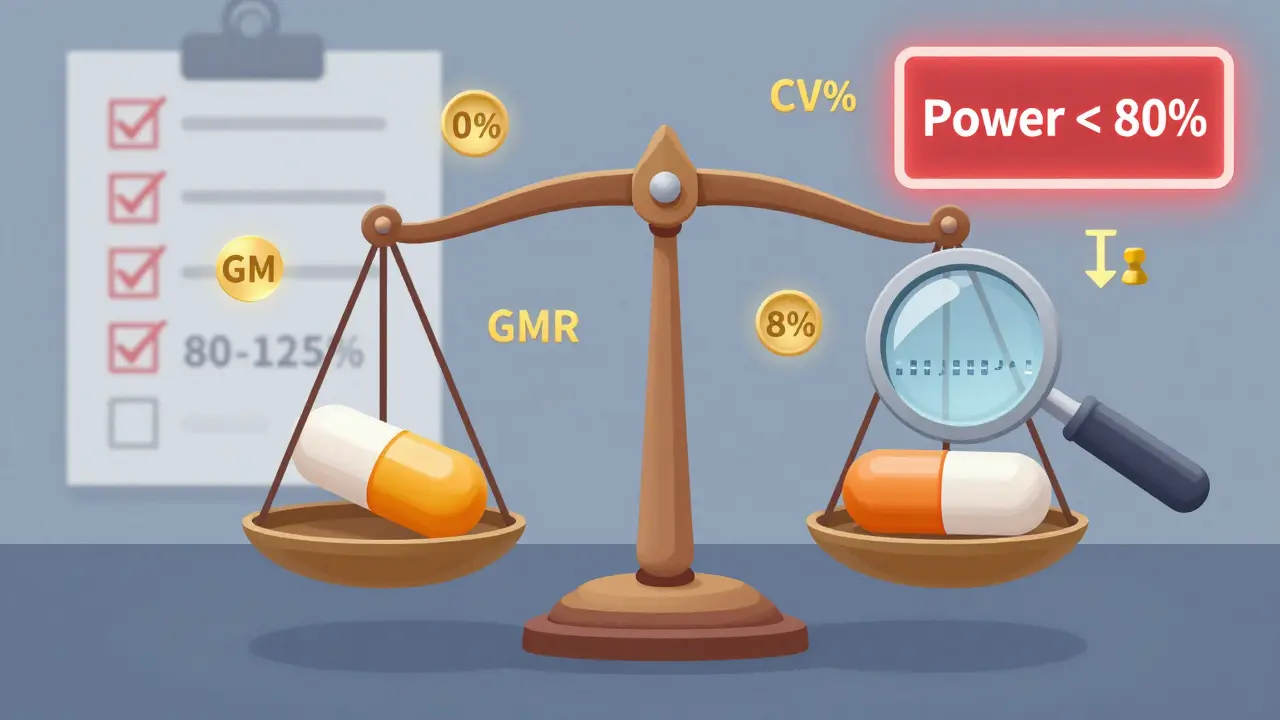
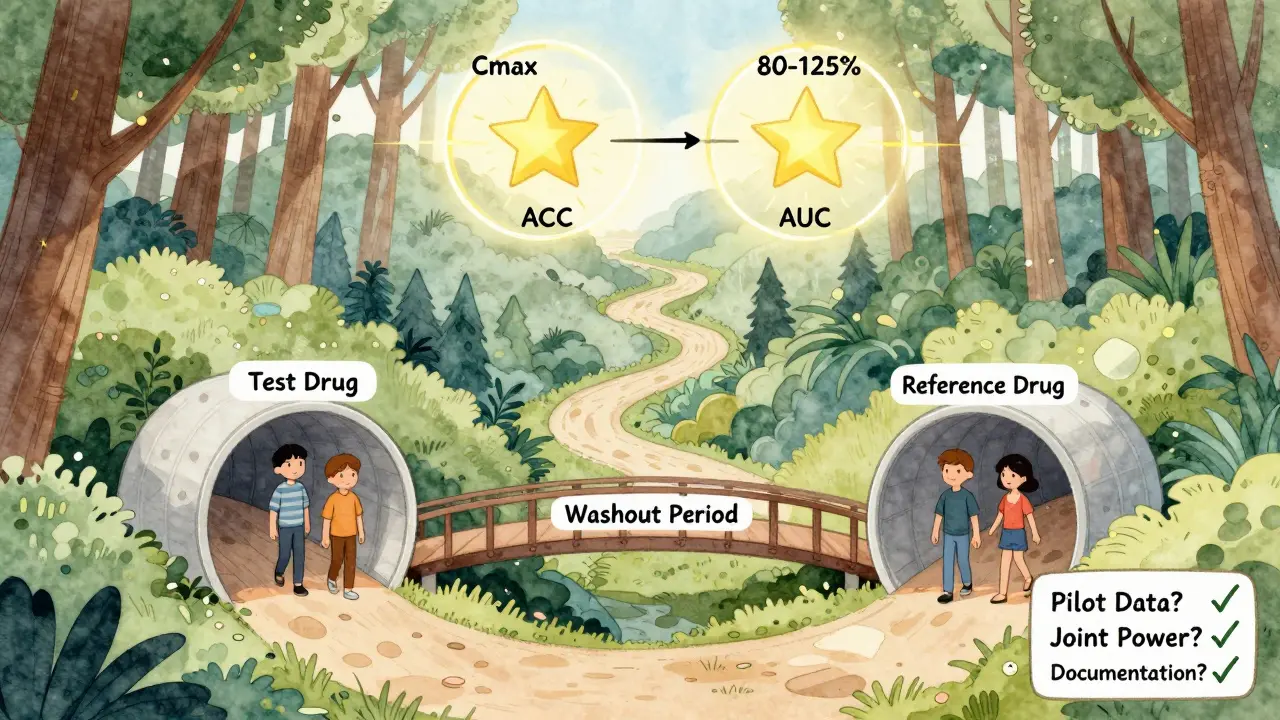
Bioequivalence studies aren’t about proving one drug is better than another. They’re about proving two drugs are the same enough to be swapped without risk. The FDA and EMA require that the test drug’s absorption rate and extent match the reference drug within strict limits: typically 80% to 125% for the geometric mean ratio of key metrics like Cmax and AUC. But how do you prove that? You don’t just measure a few people and hope for the best. You design the study so that if the drugs are truly equivalent, your test has a high chance of showing it.
That’s where statistical power comes in. Power is the probability that your study will correctly detect bioequivalence when it exists. Most regulators expect at least 80% power, and many prefer 90%. That means, out of 100 identical studies done under the same conditions, 80 to 90 of them should pass. If your power is only 60%, you’re rolling the dice. And regulators won’t accept that.
Sample size is the lever you pull to get the right power. But it’s not linear. A small change in variability can double your required participants. And if you don’t get it right, your study gets rejected. According to the FDA’s 2021 Annual Report, 22% of Complete Response Letters for generic drugs cited inadequate sample size or power calculations as a primary reason for rejection.
What Drives Sample Size in a BE Study?
There are four main factors that determine how many people you need:
- Within-subject coefficient of variation (CV%) - This measures how much a person’s own response to the drug varies from one dose to the next. If a drug causes wildly different blood levels in the same person across doses, you need more people to see the true effect. A CV of 10%? You might need just 18 subjects. A CV of 35%? You’ll need over 80. For highly variable drugs (CV > 30%), regulators allow special methods like RSABE to reduce sample size, but only if you meet strict criteria.
- Expected geometric mean ratio (GMR) - This is your best guess of how the test drug compares to the reference. Most generic manufacturers aim for a GMR of 0.95 to 1.05. But if you assume 1.00 and the real ratio is 0.92, your sample size calculation is off by 30% or more. Always use conservative estimates based on pilot data, not literature.
- Equivalence margins - The standard is 80-125%. But for some drugs, especially those with high variability, the EMA allows wider margins for Cmax (75-133%), which can cut sample size by 15-20%. The FDA doesn’t usually allow this unless under RSABE.
- Study design - Most BE studies use a crossover design (each participant gets both drugs), which is more efficient than parallel designs (two separate groups). Crossover designs reduce variability because each person acts as their own control. But they require careful handling of sequence and period effects.
Let’s say you’re testing a generic version of a blood thinner. Literature says the CV is 20%, and you expect a GMR of 0.98. With 80% power and 80-125% margins, you’d need about 26 subjects. But if your pilot data shows a CV of 30%, you jump to 52 subjects. That’s not a small difference-it’s a budget breaker.
How to Calculate Sample Size: The Math Behind It
You don’t need to memorize the formula, but you should understand what goes into it. The standard formula for crossover BE studies is:
N = 2 × (σ² × (Z₁₋α + Z₁₋β)²) / (ln(θ₁) - ln(μₜ/μᵣ))²
Where:
- σ² = within-subject variance (derived from CV%)
- Z₁₋α = normal distribution value for alpha (1.96 for α=0.05)
- Z₁₋β = normal distribution value for power (0.84 for 80% power, 1.28 for 90%)
- θ₁ = lower equivalence limit (0.80)
- μₜ/μᵣ = expected test/reference ratio (GMR)
This looks intimidating, and it is-unless you use the right tools. Most biostatisticians rely on software like PASS, nQuery, or FARTSSIE. These programs plug in your CV, GMR, power, and margins and spit out the number. But here’s the problem: many non-statisticians try to use online calculators meant for clinical trials, not BE studies. That’s like using a kitchen scale to weigh a truck. You’ll get the wrong answer.
For example, the ClinCalc BE Sample Size Calculator is built specifically for bioequivalence. It lets you adjust CV%, GMR, and power in real time. Industry surveys show 78% of statisticians use these tools iteratively-testing different scenarios to find the sweet spot between feasibility and regulatory compliance.

What Regulators Actually Look For
The FDA and EMA don’t just want a number. They want proof you did the work. Your submission must include:
- The software used and its version
- All input parameters with justification
- How you estimated CV% (pilot study? literature?)
- How you handled dropouts (always add 10-15%)
- Whether you calculated power for both Cmax and AUC (not just the more variable one)
In 2021, 18% of statistical deficiencies in generic drug submissions were due to incomplete documentation. That’s avoidable. If you’re submitting to the FDA, use their 2022 Bioequivalence Review Template as your checklist. If you’re submitting to the EMA, follow their 2010 Guideline on Bioequivalence. Don’t assume they’re the same-they’re not.
And don’t forget joint power. Many sponsors only calculate power for Cmax because it’s usually more variable. But if AUC falls outside the range, your study fails. The American Statistical Association recommends calculating power for both endpoints together. Only 45% of sponsors do this, according to a 2022 survey. That’s a recipe for rejection.
Common Mistakes and How to Avoid Them
Here are the top five mistakes in BE sample size planning-and how to fix them:
- Using literature CVs without validation - FDA reviews show literature-based CVs underestimate true variability by 5-8 percentage points in 63% of cases. Always run a small pilot study if possible.
- Assuming a perfect GMR of 1.00 - Real-world generic drugs rarely hit exactly 1.00. Assuming 1.00 when the true ratio is 0.95 increases required sample size by 32%. Use 0.95-1.05 as your realistic range.
- Ignoring dropouts - If you enroll 30 people and 5 drop out, your power drops fast. Always add 10-15% to your calculated sample size.
- Forgetting sequence effects - In crossover designs, the order matters. If the first drug affects the second, you’ve introduced bias. Proper washout periods and randomization are non-negotiable. The EMA rejected 29% of BE studies in 2022 for poor sequence handling.
- Not using specialized tools - Generic power calculators don’t account for log-normal distributions or regulatory margins. Use BE-specific software. If your team doesn’t have a biostatistician, hire one.
The Future: Adaptive Designs and Model-Informed Approaches
BE study design isn’t frozen in time. The FDA’s 2023 draft guidance introduces adaptive designs, where you can re-estimate sample size halfway through based on interim data. This reduces the risk of underpowered studies without over-enrolling. But it’s complex and requires pre-specified rules.
Another emerging approach is model-informed bioequivalence, where pharmacokinetic modeling replaces traditional statistical tests. This could cut sample sizes by 30-50% for complex drugs like inhalers or long-acting injectables. But as of 2023, only 5% of submissions use this method. Regulators are still cautious.
For now, the old rules still apply: 80-90% power, 80-125% margins, proper CV estimation, and solid documentation. The future might change things, but right now, your job is to get it right under today’s standards.
What You Should Do Next
If you’re planning a BE study, here’s your action list:
- Run a small pilot study to get real CV% data-not literature values.
- Use a BE-specific sample size calculator (ClinCalc, PASS, or FARTSSIE).
- Calculate power for both Cmax and AUC together.
- Add 10-15% to your sample size for dropouts.
- Document every step: software, inputs, assumptions, and justifications.
- Have a biostatistician review your plan before you enroll a single subject.
There’s no shortcut. A failed BE study doesn’t just delay a product-it costs millions. And in the world of generic drugs, where margins are thin, one miscalculation can sink the whole project. Get the statistics right, and you’re not just meeting regulations-you’re building trust in a generic drug that could save lives.
What is the minimum power required for a bioequivalence study?
Regulatory agencies like the FDA and EMA typically require a minimum of 80% statistical power, meaning there’s an 80% chance the study will correctly conclude bioequivalence if the drugs are truly equivalent. Many sponsors aim for 90% power, especially for drugs with narrow therapeutic windows, to reduce the risk of failure. Power below 80% is generally not accepted by regulators.
How does variability (CV%) affect sample size in BE studies?
Variability has a direct and dramatic impact. For example, with a 20% within-subject CV, a typical crossover BE study might need 26 subjects to achieve 80% power. But if the CV increases to 30%, the required sample size jumps to 52. For highly variable drugs (CV > 30%), regulators allow reference-scaled average bioequivalence (RSABE), which adjusts equivalence limits based on observed variability and can reduce sample size from over 100 to 24-48 subjects.
Can I use sample size calculators designed for clinical trials for BE studies?
No. Standard clinical trial calculators assume normal distributions and superiority testing, while BE studies use log-normal data and equivalence testing with 80-125% margins. Using the wrong tool can underestimate required sample size by 25-35%, leading to study failure. Always use BE-specific tools like ClinCalc, PASS, or FARTSSIE.
Why do I need to calculate power for both Cmax and AUC?
Cmax and AUC measure different aspects of drug absorption. Cmax reflects peak concentration, while AUC reflects total exposure. Both must fall within the 80-125% range for bioequivalence to be concluded. If you only calculate power for Cmax (the more variable parameter), you risk failing on AUC. Joint power for both endpoints is recommended by the American Statistical Association and is required by most regulators.
What happens if I don’t account for dropouts in my sample size calculation?
If you enroll exactly the number of subjects your calculation says and some drop out, your effective power drops significantly. For example, if you need 30 subjects and 5 drop out, your power may fall from 80% to 65-70%, making it harder to prove bioequivalence. Best practice is to add 10-15% to your calculated sample size to account for expected dropouts.
Is 90% power always better than 80%?
It depends. For most drugs, 80% power is acceptable. But for drugs with narrow therapeutic indices-like warfarin, digoxin, or lithium-where small differences can cause toxicity or inefficacy, regulators expect 90% power. Higher power reduces the chance of a false negative, but it also increases cost and subject burden. The choice should be justified based on drug safety profile and regulatory expectations.
How do I estimate within-subject CV% if I don’t have pilot data?
If pilot data isn’t available, use published data from the reference product or similar drugs. But be conservative: the FDA found that literature-based CVs underestimate true variability by 5-8 percentage points in 63% of cases. Add 5-8% to the literature value as a buffer. If the drug is new or complex, consider running a small pilot study-this is often cheaper than failing a full study.


bro just use excel lol why are we overcomplicating this? i did a be study last year and we just guessed and it passed 😎